Use the Q&A feature
Both Power BI Desktop and the Power BI service allow you to create visualizations that provide answers to specific questions. Although this gives you great control over formatting, it won’t work if you have RLS set up and users only have read access to content.
Another way to explore data in Power BI is to use the Q&A feature, also known as natural language queries. This feature enables you to get answers to your questions by typing them in natural language. Even users with read-only access can query datasets in a natural language.
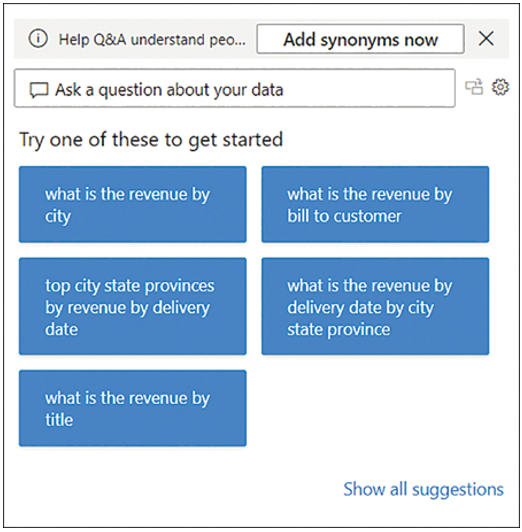
To start using Q&A in Power BI Desktop, you need to be in the Report view. To insert the Q&A visual, double-click the empty space on the report canvas. Alternatively, you can select Q&A on the Insert ribbon. Either way, you’ll see a visual, as shown in Figure 2-14.

FIGURE 2-14 Q&A visual
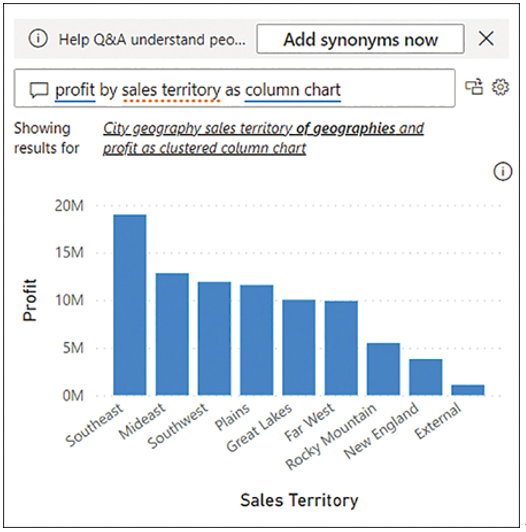
Although the suggestions may not be immediately useful, you can ask your own questions. For example, you can enter profit by sales territory as column chart, and the result will look like Figure 2-15.

FIGURE 2-15 Q&A showing profit by sales territory
Note that the Q&A visual updates its result as you type. Before we typed “as column chart,” the Q&A visual was showing a bar chart.
If desired, you can turn the Q&A result into a standard visual by selecting the button between the question and the cog wheel in the upper-right corner of the Q&A visual.
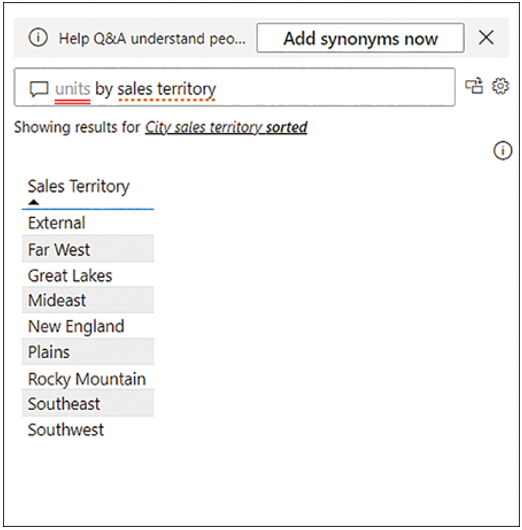
The Q&A visual depends on the field names as they are defined in the data model. For example, entering units by sales territory in the Q&A visual won’t provide any meaningful results, as seen in Figure 2-16.

FIGURE 2-16 Q&A visual showing units by sales territory
This issue can be fixed by teaching Q&A, as outlined next.


