Use quick measures
A measure in Power BI is a dynamic evaluation of a DAX query that will change in response to interactions with other visuals, enabling quick, meaningful exploration of your data. Creating efficient measures will be one of the smartest things you can do to build insightful reports. If you’re new to DAX and writing measures, or you’re wanting to perform quick analysis, you have the option of creating a quick measure. There are several ways to create a quick measure:
- Select Quick measure from the Home ribbon.
- Right-click or select the ellipsis next to a table or column in the Fields pane and select New quick measure. This method may prefill the quick measure form shown next.
- If you already use a field in a visual, select the dropdown arrow next to the field in the Values section and select New quick measure. This method also may prefill the quick measure form shown next. If possible, this will add the new quick measure to the existing visualization. You’ll be able to use this measure in other visuals too.
The following calculations are available as quick measures:
- Aggregate per category
- Average per category
- Variance per category
- Max per category
- Min per category
- Weighted average per category
- Filters
- Filtered value
- Difference from filtered value
- Percentage difference from filtered value
- Sales from new customers
- Time Intelligence
- Year-to-date total
- Quarter-to-date total
- Month-to-date total
- Year-over-year change
- Quarter-over-quarter change
- Month-over-month change
- Rolling average
- Totals
- Running total
- Total for category (filters applied)
- Total for category (filters not applied)
- Mathematical operations
- Addition
- Subtraction
- Multiplication
- Division
- Percentage difference
- Correlation coefficient
- Text
- Star rating
- Concatenated list of values
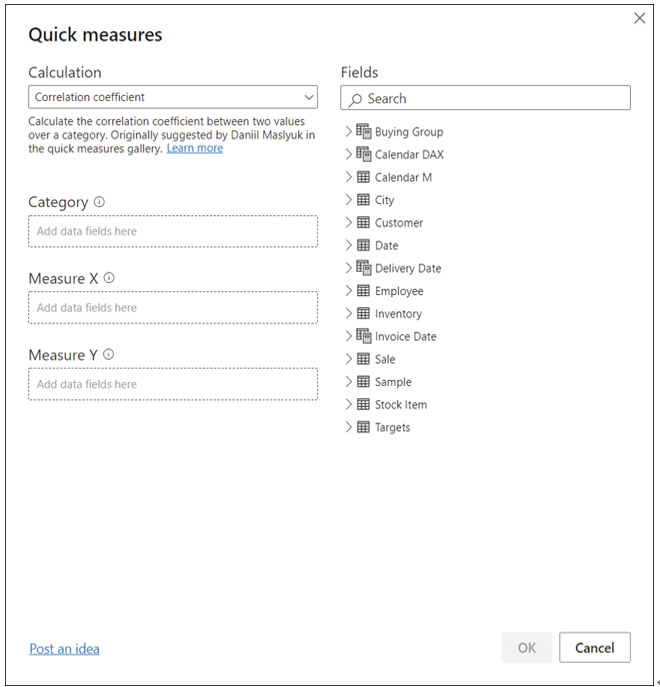
Each calculation has its own description and a list of field wells—you can see an example in Figure 2-29.

FIGURE 2-29 Quick Measures dialog box
For example, by using quick measures, you can calculate average profit per employee for Wide World Importers as follows:
Ensure the Sale table is selected in the Fields pane.
Select Quick measure on the Home ribbon.
From the Calculation dropdown list, select Average per category.
Drag the Profit column from the Sale table to the Base value field well.
Drag the Employee column from the Employee table to the Category field well.
Select OK.
Once done, you can find the new measure called Profit average per Employee in the Fields pane.
Note Home Table
Your new quick measure will be created in the last active table. If you’re struggling to find the measure, you can use the search bar in the Fields pane.
To move a measure to a different table, select a measure in the Fields pane and select a new table in the Home table dropdown list on the Measure Tools ribbon.
If you select the new measure, you’ll see its DAX formula:
Click here to view code image
Profit average per Employee =
AVERAGEX(
KEEPFILTERS(VALUES(‘Employee'[Employee])),
CALCULATE(SUM(‘Sale'[Profit]))
)
You can modify the formula, if needed. Reading the DAX can be a great way to learn how measures can be written.
Need More Review? Quick Measures
For more information on quick measures, including limitations and considerations, see “Use quick measures for common calculations” at https://docs.microsoft.com/en-us/power-bi/transform-model/desktop-quick-measures.


