Removing filters
There are several DAX functions that you can use as CALCULATE modifiers to ignore filters, one of which is ALL. ALL can remove filters from:
- One or more columns from the same table
- An entire table
- The whole data model (when ALL is used with no parameters)
Important Sort By Column and ALL
If you’re removing filters from a column that is sorted by another column, you should remove filters from both columns—otherwise, you may get unexpected results.
For example, you can show profit for all sales territories regardless of any filters on the City[Sales Territory] column:
Click here to view code image
Profit All Sales Territories =
CALCULATE(
[Total Profit],
ALL(City[Sales Territory])
)
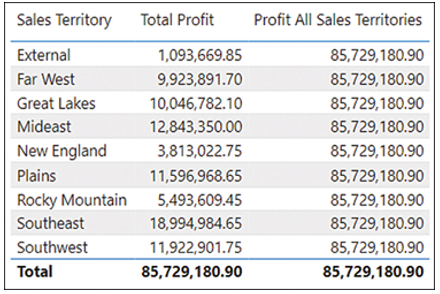
If you create a table that shows the new measure alongside Total Profit by Sales Territory, you get the results shown in Figure 2-20.

FIGURE 2-20 Total Profit and Profit All Sales Territories by Sales Territory
Note that the new measure displays the same value for any sales territory, which is the total of all sales territories combined regardless of sales territory.
Note Filter Functions In DAX
In addition to ALL, there are several other DAX functions that remove filters, such as ALLEXCEPT and ALLSELECTED. Full details of each function are outside the scope of this book. For an overview, see “Filter functions” at https://docs.microsoft.com/en-us/dax/filter-functions-dax.
Updating filters
When you specify a filter such as City[Sales Territory] = “New England”, it’s an abbreviated way that corresponds to the following filter:
Click here to view code image
FILTER(
ALL(City[Sales Territory]),
City[Sales Territory] = “New England”
)
By adding this filter, you are ignoring a filter by using ALL, and you’re adding a filter at the same time. This allows you to filter for New England regardless of the selected sales territory.
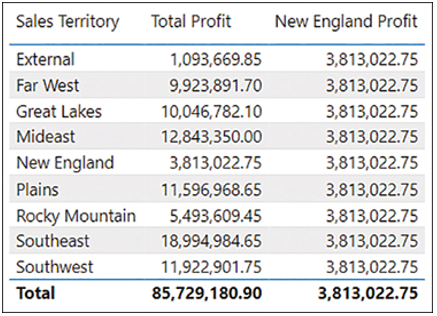
If you create a table that shows Total Profit and New England Profit by Sales Territory, the result should look like Figure 2-21.

FIGURE 2-21 Total Profit and New England Profit by Sales Territory
When you have Sales Territory on rows, each row from the Total Profit column is filtered for a single sales territory and the Total row shows values for all sales territories. In contrast, by using the measure above in the New England Profit column, you are filtering regardless of the current sales territory, showing only the New England Profit.


