Remove unnecessary columns
Columns in a data model usually serve at least one of two purposes: they could be used to support visuals or calculations, or both. It’s preferable to not load columns that aren’t used for any purpose, especially if they’ve got a high number of distinct values.
Some data warehouses include primary keys for fact tables. Although that may be useful for data audit purposes, you should remove primary keys from Power BI data models because they have a unique value for every row, and fact tables can be long. Primary keys of fact tables can occupy over 50% of data model size without bringing any benefit. In the Wide World Importers example, removing the Sale Key column from the Sale table reduces the file size by 43%.
If you need to count the number of rows in a fact table, it’s more efficient to use COUNTROWS than DISTINCTCOUNT of the primary key column.
Removing columns that are used in visuals or calculations is going to break existing reports or even the dataset. You can use the Remove Other Columns functionality in Power Query Editor to have a step to refer to if you need to add a column to your model later. This step will also prevent columns added to the dataset from being automatically brought into your model, such as a new column added to a SQL table by a database administrator.
Identify poorly performing measures, relationships, and visuals
Sometimes you may notice that the report performance is not optimal. Power BI Desktop has a feature called Performance Analyzer, which you can use to trace the slow-performing visuals and to see the DAX queries behind them.
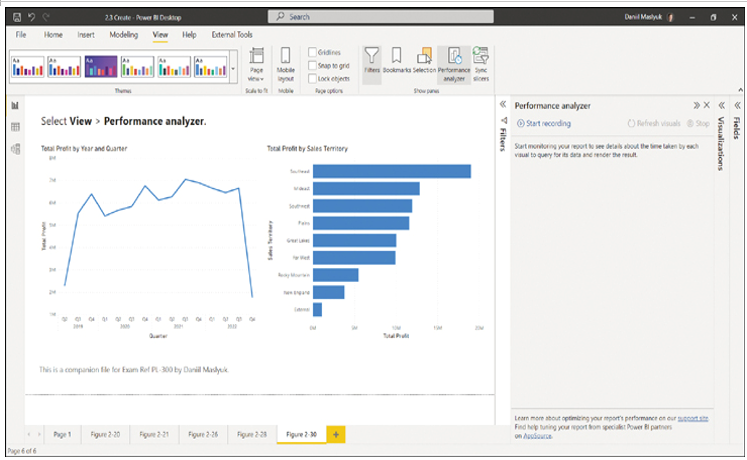
To turn on Performance Analyzer, go to the Report view and select View > Performance analyzer. This opens the Performance Analyzer pane shown in Figure 2-30.

FIGURE 2-30 Performance Analyzer
Performance Analyzer works by recording traces, and it then shows you how long each visual took to render. To start recording traces, select Start recording. After that, you need to perform some actions, such as applying filters, that will recalculate the visuals, or you can select Refresh visuals to refresh the visuals as they are. You’ll then see the rendering duration for each visual.
To identify the slowest visuals, you can sort visuals in the Performance Analyzer pane by selecting the arrow next to Duration (ms).
Each visual that contains data has a DAX query behind it, which you can copy by expanding the line of the visual in the Performance Analyzer pane and selecting Copy query. You can analyze the query further in DAX Studio, for example. It’s also possible to export all traces by selecting Export.
To clear the Performance Analyzer pane, select Clear. Once you’re done recording traces, select Stop.


