Design and implement role-playing dimensions
In some cases, there may be more than one way to filter a fact table by a dimension. In the Wide World Importers example, the Sale table has two date columns: Invoice Date Key and Delivery Date Key, both of which can be related to the Date column from the Date table. Therefore, it’s possible to analyze sales by invoice date or delivery date, depending on the business requirements. In this situation, the Date dimension is a role-playing dimension.
Note Companion File
If you’re interested in following along the examples in this chapter, you can start with the 2.0 Model.pbix file in the companion files folder. The completed examples are available in 2.1 Design.pbix.
While Power BI allows you to have multiple physical relationships between two tables, no more than one can be active at a time, and other relationships must be set as inactive. Active relationships, by default, propagate filters. The choice of which relationship should be set as active depends on the default way of looking at data by the business.
Need More Review? Active and Inactive Relationships
For a more thorough explanation of when you would use active or inactive relationships, see “Active vs inactive relationship guidance” at https://docs.microsoft.com/en-us/power-bi/guidance/relationships-active-inactive.
To create a relationship between two tables, you can drag a key from one table on top of the corresponding key from the other table in the Model view.
Note Automatic Detection of Relationships
By default, Power BI will try to detect relationships between tables automatically after you load data. In doing so, Power BI usually relies on identical column names, and the process is not always perfect. You can turn it off in Options > Current file > Data load if required.
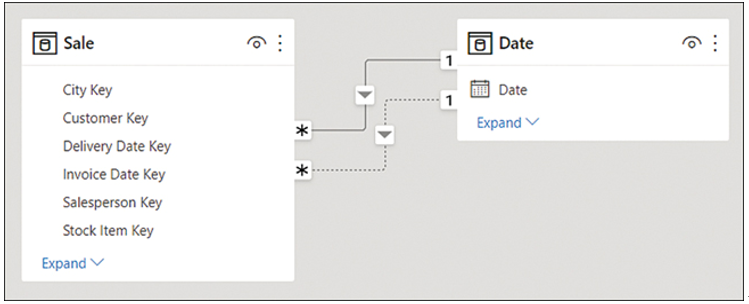
In our Wide World Importers example, you can drag the Date column from the Date table on top of the Invoice Date Key column in the Sale table. This will create an active relationship, signified by the solid line. Next, you can drag the Date column from the Date table on top of the Delivery Date Key column from the Sale table. This will create an inactive relationship, signified by the dashed line. The result should look like Figure 2-3.

FIGURE 2-3 Relationships between Sale and Date
If you hover over a relationship line in the Model view, it’ll highlight the fields that participate in the relationship.
Note Cardinality and Cross-Filter Direction
Note how each relationship line in Figure 2-3 has 1 and * at its ends, as well as an arrowhead in the middle. This represents the cardinality and cross-filter direction, respectively, and we review those concepts in the next section.
In our Wide World Importers model, you should also create the relationships listed in Table 2-1.
TABLE 2-1 Additional relationships in Wide World Importers
| FROM: TABLE (COLUMN) | TO: TABLE (COLUMN) |
| Sale (City Key) | City (City Key) |
| Sale (Customer Key) | Customer (Customer Key) |
| Sale (Salesperson Key) | Employee (Employee Key) |
| Sale (Stock Item Key) | Stock Item (Stock Item Key) |
Inactive relationships can be activated by using the USERELATIONSHIP function in DAX, which also deactivates the default active relationship, if any. The following is an example of a measure that uses USERELATIONSHIP:
Click here to view code image
Revenue by Delivery Date =
CALCULATE(
[Revenue],
USERELATIONSHIP(
‘Date'[Date],
Sale[Delivery Date Key]
)
)
To use USERELATIONSHIP, you need to define a relationship in the model first so that the function only works for existing relationships. This approach is useful for scenarios such as the Wide World Importers example, where we have multiple date columns within the same fact table.
Need More Review? CALCULATE and USERELATIONSHIP
CALCULATE is the most important function in DAX, and we review it in more detail later in this chapter. It’s important to be aware of certain limitations of USERELATIONSHIP. For more information, see “USERELATIONSHIP” at https://docs.microsoft.com/en-us/dax/userelationship-function-dax.
If you have a number of measures that you want to analyze by using different relationships, this may result in your data model having many similar measures, cluttering your data model to a degree.
Another drawback of using USERELATIONSHIP is that you cannot analyze data by using two relationships at the same time. For instance, if you have a single Date table, it won’t be possible to see which sales were invoiced last year and shipped this year.
An alternative to USERELATIONSHIP that addresses these drawbacks is to use separate dimensions for each role or relationship. In Wide World Importers, you would have Delivery Date and Invoice Date dimensions, which would make it possible to analyze sales by both delivery and invoice dates.
There are a few ways to create the new dimensions based on the existing Date table, one of which is to use calculated tables. For the Invoice Date table, the DAX formula would be as follows:
Invoice Date = ‘Date’
The benefit of using calculated tables instead of referencing or duplicating queries in Power Query is that if you have calculated columns in your Date table, they will be copied in a calculated table, while you’ll need to re-create the same columns if you use Power Query to create the copies of the dimension.
When you’re creating separate dimensions, it’s best to rename the columns to make it clear where fields are coming from. For example, instead of leaving the column called Date, it’s best to rename it to Invoice Date. You can do so by right-clicking a field in the Fields pane and selecting Rename or by double-clicking a field. Alternatively, you can rename fields by using a more complex calculated table expression. For example, you could use the SELECTCOLUMNS function in DAX to rename columns.
Note Calculated Tables
DAX allows you to create far more sophisticated calculated tables than copies of existing tables. We review calculated tables in more detail in Skill 2.2: Develop a data model.


