Create hierarchies
Power BI allows you to group columns into hierarchies, which you can then use in visuals.
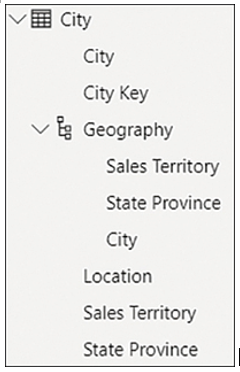
In our Wide World Importers example, you can create a geographical hierarchy as follows:
Go to the Model view.
Right-click the Sales Territory column in the City table.
Select Create hierarchy.
Double-click the newly created hierarchy and rename it to Geography.
In the Fields pane, drag the State Province column on top of Geography.
Repeat the previous step for the City column.
Once created, the result should look like Figure 2-8.

FIGURE 2-8 The Geography hierarchy
One column can be part of multiple hierarchies, and you can rename hierarchy items without affecting the original columns. At the same time, you don’t need to sort a hierarchy element by another column, because it inherits this property from the original column. The original column can be hidden, if desired.
A hierarchy can be created using only existing columns, and the columns must be in the same table. To include columns from different tables in the same hierarchy, you have to bring the columns into one table. You can do that by using Power Query or the RELATED function in DAX, for example.
Need More Review? RELATED In DAX
For more information on the RELATED function in DAX, including examples and the requirements for using the function, see “RELATED” at https://docs.microsoft.com/en-us/dax/related-function-dax.
Apart from the convenience of dragging multiple fields to a visual at once in the right order, a hierarchy does not provide any special benefits in Power BI compared to using columns individually, because you can use both hierarchies and multiple individual columns together in fields to achieve the same result.


