Context transition
Another important function of CALCULATE is context transition, which refers to transitioning from row context to filter context.
In DAX, there are two evaluation contexts:
- Row context This context can be understood as “the current row.” Row context is present in calculated columns and iterators. Iterators are functions that take a table and go row by row, evaluating an expression for each row. For example, FILTER is an iterator; it takes a table, and for each row, it evaluates a filter condition. Those rows that satisfy the condition are included in the result of FILTER.
- Filter context This context can be understood as “all applied filters.” Filters can come from slicers, from the Filter pane, or by selecting a visual element. Filters can also be applied programmatically by using DAX.
To review context transition, let’s create a sample table in the data model:
On the Home ribbon, select Enter data.
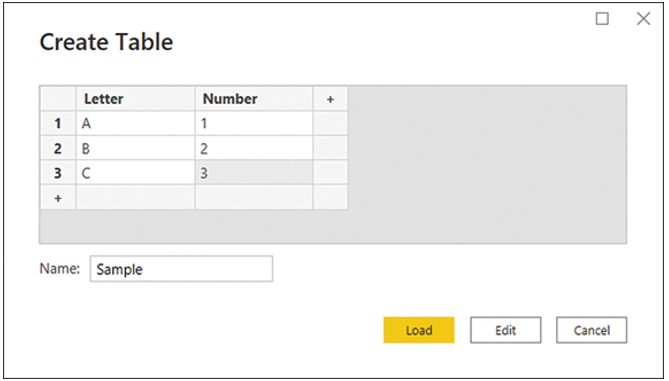
Enter Sample in the Name box.
Enter the data shown in Figure 2-22.

FIGURE 2-22 Entering data
Select Load.
Now that you have the table, you can add two calculated columns to it to see the effect of context transition:
Go to the Data view.
Select the Sample table in the Fields pane.
Create a calculated column with the following formula:
Click here to view code image
Sum Number = SUM(‘Sample'[Number])
Create another calculated column with the following formula:
Click here to view code image
Calculate Sum Number = CALCULATE(SUM(‘Sample'[Number]))
The result should look like Figure 2-23.

FIGURE 2-23 Calculated columns in the Sample table
SUM, as an aggregation function, uses filter context. Because there are no filters in the data model—there are no visuals, and you’re not adding any filters by using DAX—SUM aggregates the whole Number column, so the result in the Sum Number column is 6 regardless of the row.
On the other hand, the Calculate Sum Number column uses the same formula as Sum Number, but importantly has been wrapped in CALCULATE. CALCULATE automatically performs context transition, so the result is different from using the SUM function alone. Context transition takes all values from all other columns and uses them as filters. Therefore, for the first row, you aggregate the Number column, where:
- Sample[Letter] is A
- Sample[Number] is 1
- Sample[Sum Number] is 6
Where the sum of 1 is equal to 1, since there’s only one such row that meets these filters, you get 1. Separately for row 2, the sum of 2 equals 2, and for row 3, the sum of 3 equals 3. Context transition can be made even clearer by modifying the Sample table slightly as follows:
On the Home ribbon, select Transform data.
Select the Sample query.
Select the cog wheel in the Source step.
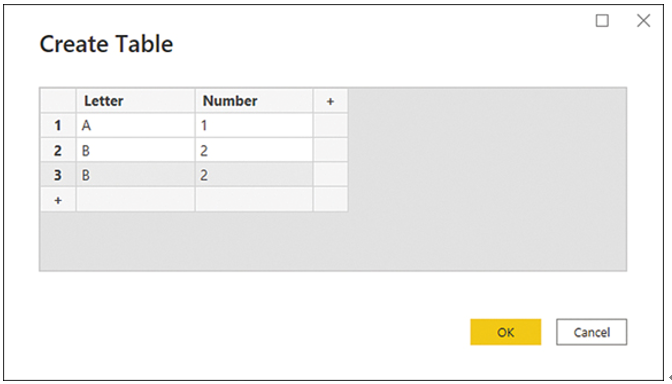
Change the third row to match the second row, as shown in Figure 2-24.

FIGURE 2-24 Modified Sample table
Select OK.
On the Home ribbon of Power Query Editor, select Close & Apply.
If you now look at the Sample table in the Data view, the result will look like Figure 2-25.

FIGURE 2-25 Sample table after update
Although the first row is calculated as you saw in the previous example, the second and third rows are now both showing 4. Intuitively, you could expect to see 2 and 2 in each row, though you’re getting 4 and 4. This is because for each row, due to context transition triggered by CALCULATE, you’re summing the Number column, where
- Sample[Letter] is B
- Sample[Number] is 2
- Sample[Sum Number] is 5
Because there are two such rows, you get 2 + 2 = 4 in both rows.


